
Oceana Bal Harbour Rental Rates: What the Monthly Figure Leaves Out
By Ariel Lima ·
Every rental figure published about Oceana Bal Harbour is a monthly rate. The MLS reports it, the listing sites repeat it, and owners compare themselves to their neighbours with it. It is the wrong number.
What an owner contracts for is not a rate. It is a rate multiplied by a term. I read fifteen closed Oceana leases from 2026 in full and computed that second number for each one. The two measures do not agree, and where they disagree the gap runs to tens of thousands of dollars on residences of identical size.
Does a short lease command a higher rate at Oceana?
Yes. Three things point that way, and they are not the same kind of evidence.
Three of the fifteen closed leases ran six months. All three closed above their final asking price, by a median of 5.3 per cent. Ten ran twelve months. I found no twelve-month lease in this set that closed above its final asking price: four landed exactly on it and six closed below, a median of 3.5 per cent under ask.
Owners price this premium deliberately. Three listings in the set filled in both an annual rate and a seasonal rate in the MLS rate fields, publishing two prices for the same residence. The seasonal rate stood 12.5, 15.8 and 26.3 per cent above the annual rate on those three listings.
Those are separate findings. The paired rates show owners intend a premium; the closings show shorter terms associated with higher rates in this group. Neither isolates how much of that premium the term itself earns. That is where most analysis of this question stops.
Does the premium survive the shorter term?
Five of the fifteen closed leases were residences of 1,704 square feet — the same floor plan, in the same condominium, let in the same year. Five is the smallest group I will report as an aggregate, and this one sits exactly at that floor.
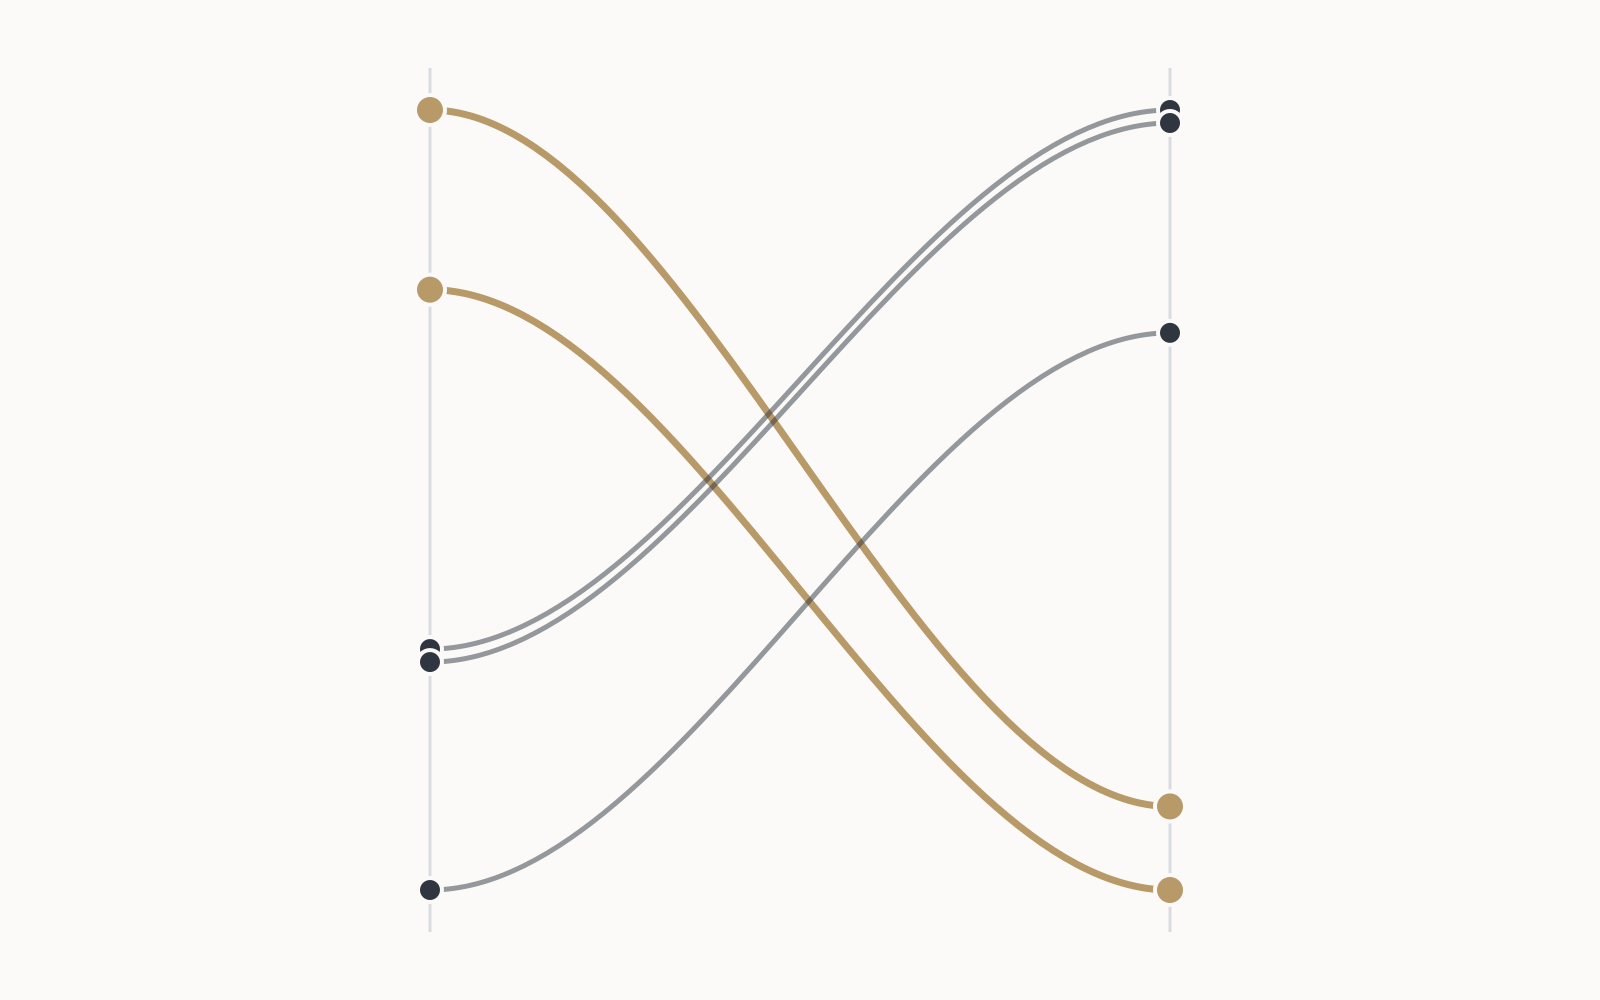
Ranked by monthly rate, those five run from $8.80 to $12.62 per square foot. Ranked by total contracted rent — the rate multiplied by the number of months the tenant is committed to — they run from $120,000 to $204,000.
The two rankings are not the same ranking. The highest monthly rate of the five, 43 per cent above the lowest, produces the fourth-largest total of the five. The distance between the largest total and the smallest is $84,000, on residences with the same square footage in the same building.
Winning the rate comparison and securing the most rent are not the same thing.
What would the short lease have to do to catch up?
The twelve-month leases in that group of five produced a median total of $204,000. Measured against it:
- A six-month lease at the top of the group’s rate range needs 3.5 additional months let at that same rate to reach $204,000 — nine and a half months of the year occupied, not six.
- A six-month lease at the group’s second-highest rate needs 4.2 additional months, or roughly ten months of the year.
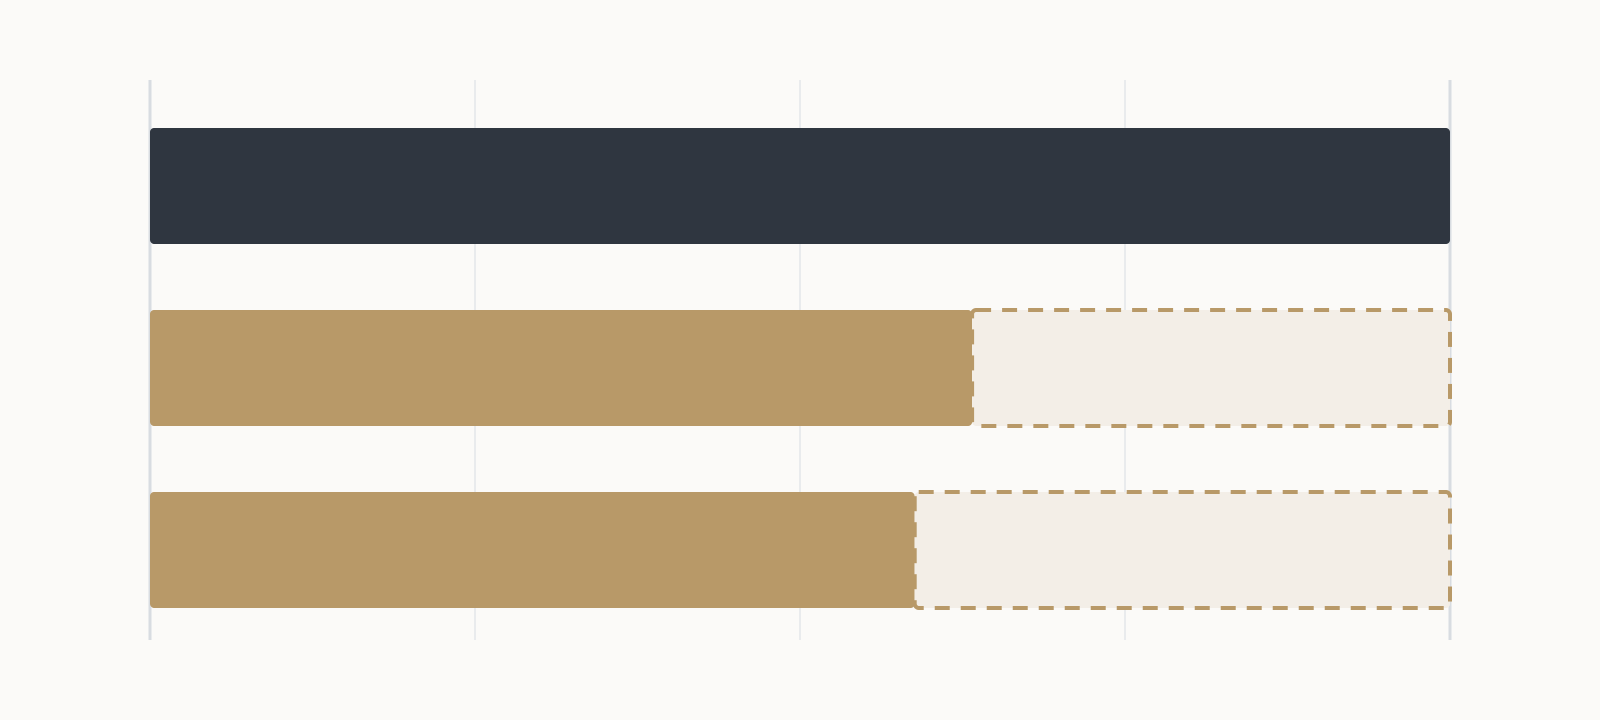
That is the whole question: can the residence be re-let fast enough, twice a year, at the premium rate?
The marketing times in this set argue against it. The three six-month leases took a median of 167 days on market to find their tenant. The ten twelve-month leases took a median of 70 days. The longer marketing periods in this small group make a quick second letting an assumption to test rather than revenue to count on.
Two caveats, and they matter. Days on market measures how long a listing was marketed, not how long the residence sat empty — several of these were occupied while listed, and the MLS occupancy field distinguishes them. And three leases is a small group. The direction is clear; the precise figure is not load-bearing.
What rates did Oceana leases close at across the set?
Across the fifteen closed leases, the median rate was $11.08 per square foot per month, in a range from $8.31 to $18.79. The median total contracted rent was $204,000, in a range from $90,000 to $525,000.
Split by term, the ordering inverts between the two measures:
| Term | Leases | Median rate | Median size |
|---|---|---|---|
| Six months | 3 | $11.84 / sf | 1,704 sf |
| Twelve months | 10 | $10.56 / sf | 1,704 sf |
Two leases in the set ran seven months. They are absent from the table because two residences of 3,992 and 2,233 square feet cannot produce a median that means anything, and the larger one’s total reflects its size far more than its term.
Why is total contracted rent not published anywhere?
Because the source data will not support the calculation until it is cleaned, and cleaning it is work nobody has a reason to do.
Lease term reaches the MLS through a free-text field. Across these fifteen records it carried six distinct strings. Twelve state a term in months and can be taken at face value. Three use a years unit, with the values 1, 12 and 365. The first reads literally as one year, which is twelve months, and needs no interpretation at all. The other two do not survive a literal reading — twelve years and three hundred sixty-five years are not residential lease terms — and I have read both as twelve months. That is an interpretation on two records, and it is stated here rather than buried.
Two further fields encode the same information and disagree with it. A rent-frequency field and the suffix on the list price contradict each other on three of the fifteen records, including a residence whose list price is suffixed as annual at a figure that is plainly monthly.
There is a further obstacle, and it is the decisive one. The standard closed-lease export carries no lease-term field at all. Term cannot be pulled in bulk; it exists only inside the individual record, which is why the fifteen leases behind this analysis were read one at a time rather than downloaded as a table.
A per-square-foot rate needs none of this. It divides a price by an area, and both arrive clean and in bulk from the export. It also does a job the total cannot: it compares residences of different sizes on a single scale. But the total needs the term, and the term is missing from the export and unreliable inside the record. That is a large part of why the easy measure is the one in circulation.
What should an owner take from this?
Not that short leases are a mistake. An owner who uses the residence part of the year, or who wants it back on a known date, is buying flexibility and the premium partly pays for it. That is a legitimate reason to accept a smaller total.
The point is narrower, and it is this: the premium is not free, the discount for an annual lease is not the loss it appears to be, and neither fact is visible in the number everyone compares. An owner choosing between a six-month lease at a strong rate and a twelve-month lease at a weaker one is not choosing between a better deal and a worse one. They are choosing between a known total and a total that depends on a second letting they have not yet secured.
That second letting is the whole wager, and it should be priced as one.
Can this analysis be applied to other buildings?
It can be applied to any condominium between West Palm Beach and Coconut Grove where enough leases have closed to form a group. The method needs only closed records with a readable term, and a floor plan that repeats often enough for a like-for-like comparison.
Oceana suits it well because its two towers are governed as a single condominium, so residences of identical size across both buildings sit under one set of leasing rules. Other buildings in the corridor are structured differently, and the comparison has to be built to fit each one.
Applying it to a specific residence is a private conversation, not a page. Nothing here is tied to a listing currently on the market.
Method and limits
- What was read. Fifteen closed Oceana Bal Harbour leases from 2026, each read as a full MLS detail record rather than a summary row, all read on 19 October 2026. Twelve stated a term in months. Three stated it in a years unit that had to be interpreted, and all three were read as twelve months.
- What this is not. This is the set I read, not a certified complete extract of every lease closed at the property in 2026. A lease absent from this analysis is a lease I did not read, not a lease that did not happen.
- Why no individual residences are named. Lease terms tied to an identifiable residence are not published on this site. Where figures are grouped by floor plan, the group holds five or more leases. Where they are grouped by lease term, the group spans the whole building and no residence is identifiable from it.
- These are gross rent commitments, not net returns. Association dues, property tax and transaction costs are excluded. Equal carrying costs over an equal period leave the dollar gap between two leases unchanged — they change what each one nets, not the order. The dues and tax figures have also not been verified against the county record for this analysis.
- Totals are contracted, not collected. Total contracted rent is the rate multiplied by the committed term. It does not account for early termination, renewal, or a second letting within the same year.
The monthly corridor analysis. One a month.